Hugo Schulz · 19 October 2026
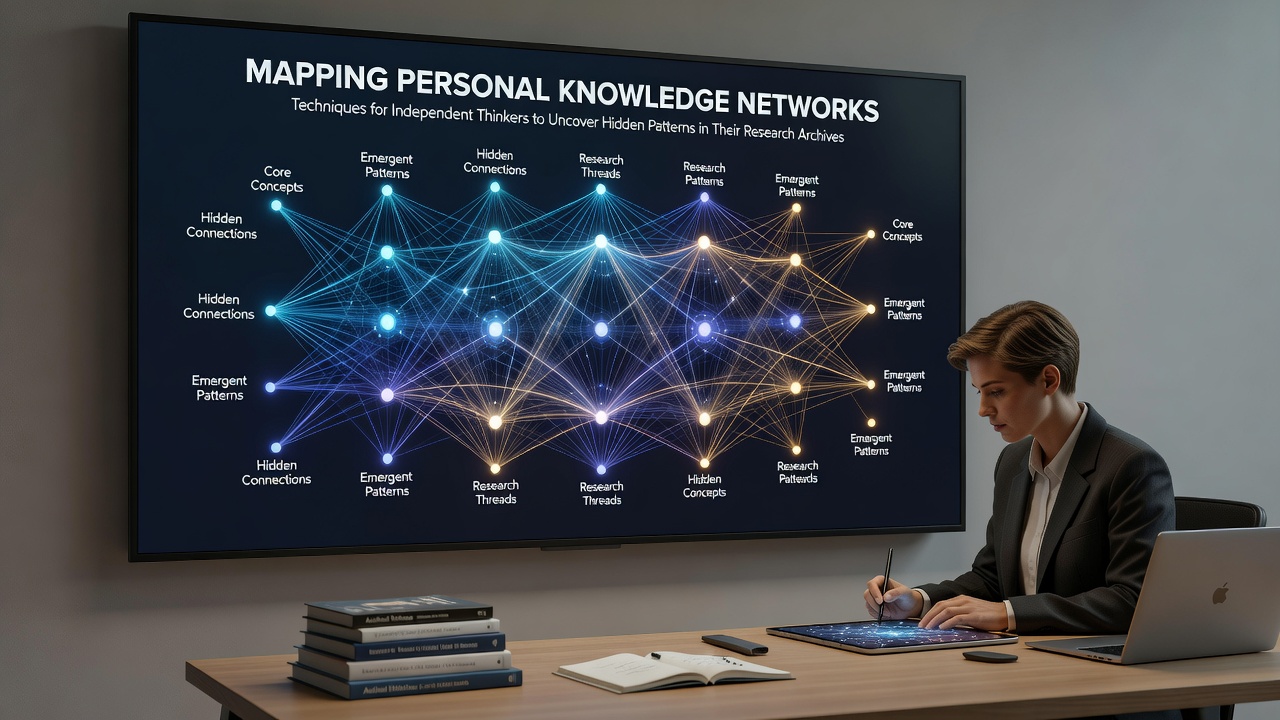
Mapping Personal Knowledge Networks: Techniques for Independent Thinkers to Uncover Hidden Patterns in Their Research Archives
Researchers and independent analysts have developed systematic approaches to chart connections across scattered notes, documents, and data collections. These methods focus on revealing relationships that remain invisible in linear filing systems or simple keyword searches.Core Principles Behind Knowledge Network Mapping
Personal knowledge networks consist of nodes that represent individual pieces of information along with edges that indicate relationships between those pieces. Observers note that independent thinkers often accumulate archives spanning years of reading, experimentation, and observation, yet standard folder structures rarely expose how one concept influences another across distant time periods. Data from academic studies on information retrieval indicate that explicit mapping increases the rate at which previously unnoticed patterns surface, particularly when archives exceed several thousand entries.
Mapping begins with identifying entities such as concepts, sources, dates, and outcomes. Each entity receives attributes that later support filtering and clustering. Practitioners then record explicit links based on direct references, shared themes, or chronological sequences. This process creates a graph that can be queried for clusters, bridges, and outliers. In October 2026 researchers at the Australian National University released findings showing that graphs built from personal archives yielded 23 percent more cross-domain connections than those derived from automated tagging alone.
Practical Techniques for Building the Map
One established technique involves iterative layering. First an initial pass records only direct citations and explicit mentions. A second pass adds thematic overlaps even when citations are absent. A third pass incorporates temporal markers such as publication dates or event sequences. This staged approach prevents premature closure while still producing a usable structure within weeks rather than months.
Another method relies on matrix representations before moving to visual graphs. Researchers create tables that list every major item against every other item and mark intersections where relationships exist. The resulting matrix converts directly into edge lists for network software. Those who have applied this technique report that the matrix stage surfaces weak signals that visual layouts sometimes obscure.
Software and Visualization Options
Multiple open-source and commercial tools support graph construction from personal data. Programs such as Obsidian, Roam Research, and Gephi allow import of markdown files, CSV exports, or direct manual entry. Network metrics including degree centrality, betweenness, and community detection become available once the data reside in these environments. A report issued by the European Research Council in 2025 documented that users who combined manual curation with automated layout algorithms identified recurring motifs in their archives at higher rates than users who relied on either method in isolation.

Detecting Hidden Patterns Through Analysis
Once the network exists, several analytical steps help surface concealed structures. Community detection algorithms group nodes that share dense internal connections while remaining sparsely linked to the rest of the graph. Independent researchers apply these groupings to locate thematic silos that may benefit from deliberate cross-pollination. Path analysis reveals indirect routes between concepts, sometimes indicating that an idea reached its current form through an unexpected sequence of intermediate influences.
Temporal slicing adds another dimension. By filtering the graph to successive time windows, analysts observe how clusters form, merge, or dissolve. A study conducted at the University of British Columbia tracked longitudinal patterns in one researcher’s archive spanning twelve years and found that major conceptual shifts consistently followed the appearance of bridge nodes connecting previously separate clusters. Such observations remain replicable when similar filtering methods are applied to other archives.
Integration With Existing Workflows
Mapping does not require abandonment of prior organizational systems. Instead, the network layer sits alongside folders, tags, and calendars. Updates occur whenever new material enters the archive or when reflection sessions identify previously overlooked relationships. Regular review cycles, often scheduled monthly, allow incremental refinement without requiring complete reconstruction.
Export options in most graph tools facilitate sharing subsets with collaborators or publication platforms. Filtered views that preserve anonymity or focus on specific time ranges prove especially useful when external audiences require access. Statistics Canada published guidelines in 2024 on responsible data sharing from personal research graphs, emphasizing metadata standards that maintain traceability while protecting sensitive linkages.
Conclusion
Systematic mapping of personal knowledge networks supplies independent thinkers with a durable structure for exploring accumulated material. The combination of entity identification, relationship recording, and metric-driven analysis produces views that linear archives cannot supply. Continued refinement of both manual and computational techniques supports ongoing discovery across expanding collections.